Imagine being able to simply point to places in your town where it’s unbearable in the summer heat, where trees are desperately missing, or where the air feels freshest to breathe. Now imagine your opinion actually making a difference. That’s exactly what perception maps allow – a tool we recently used in Český Těšín.
Perception maps are essentially “maps of experience” – capturing how people truly perceive their city. These aren’t complex scientific analyses, but reflections of your everyday experiences. Where do you feel comfortable? Where do you miss shade in the summer? Where do puddles form after it rains?
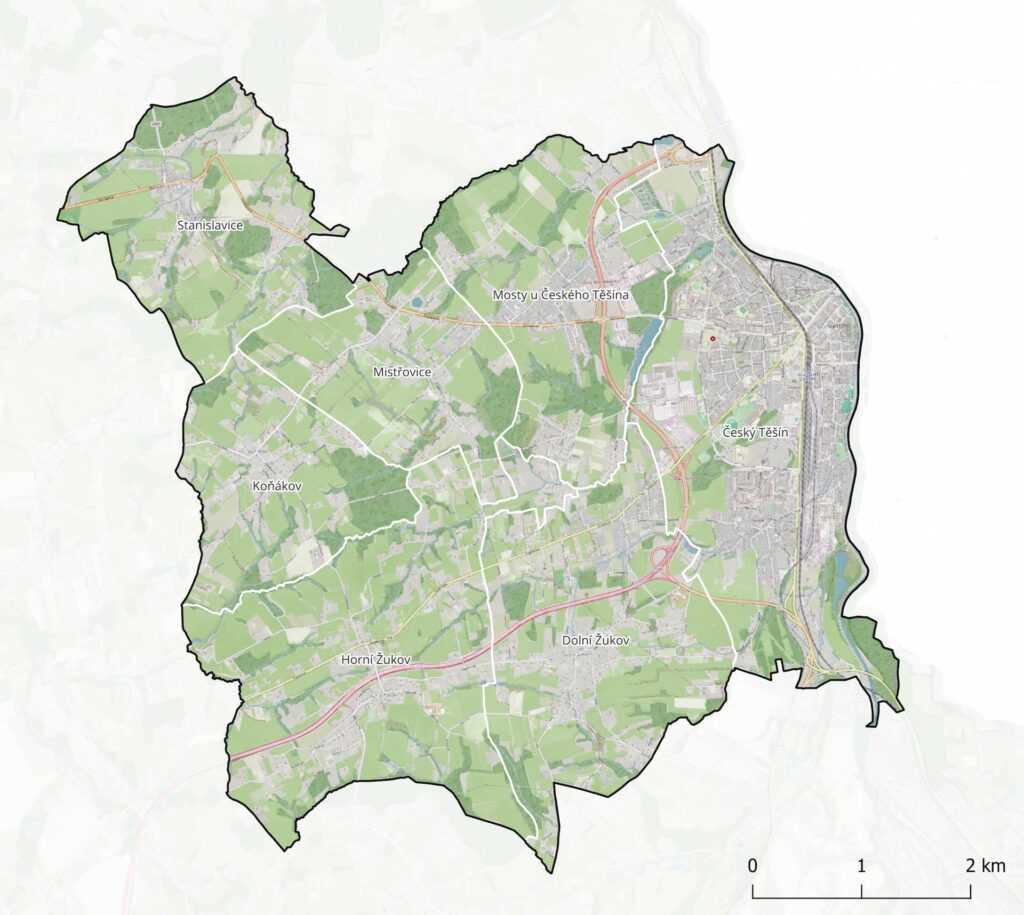
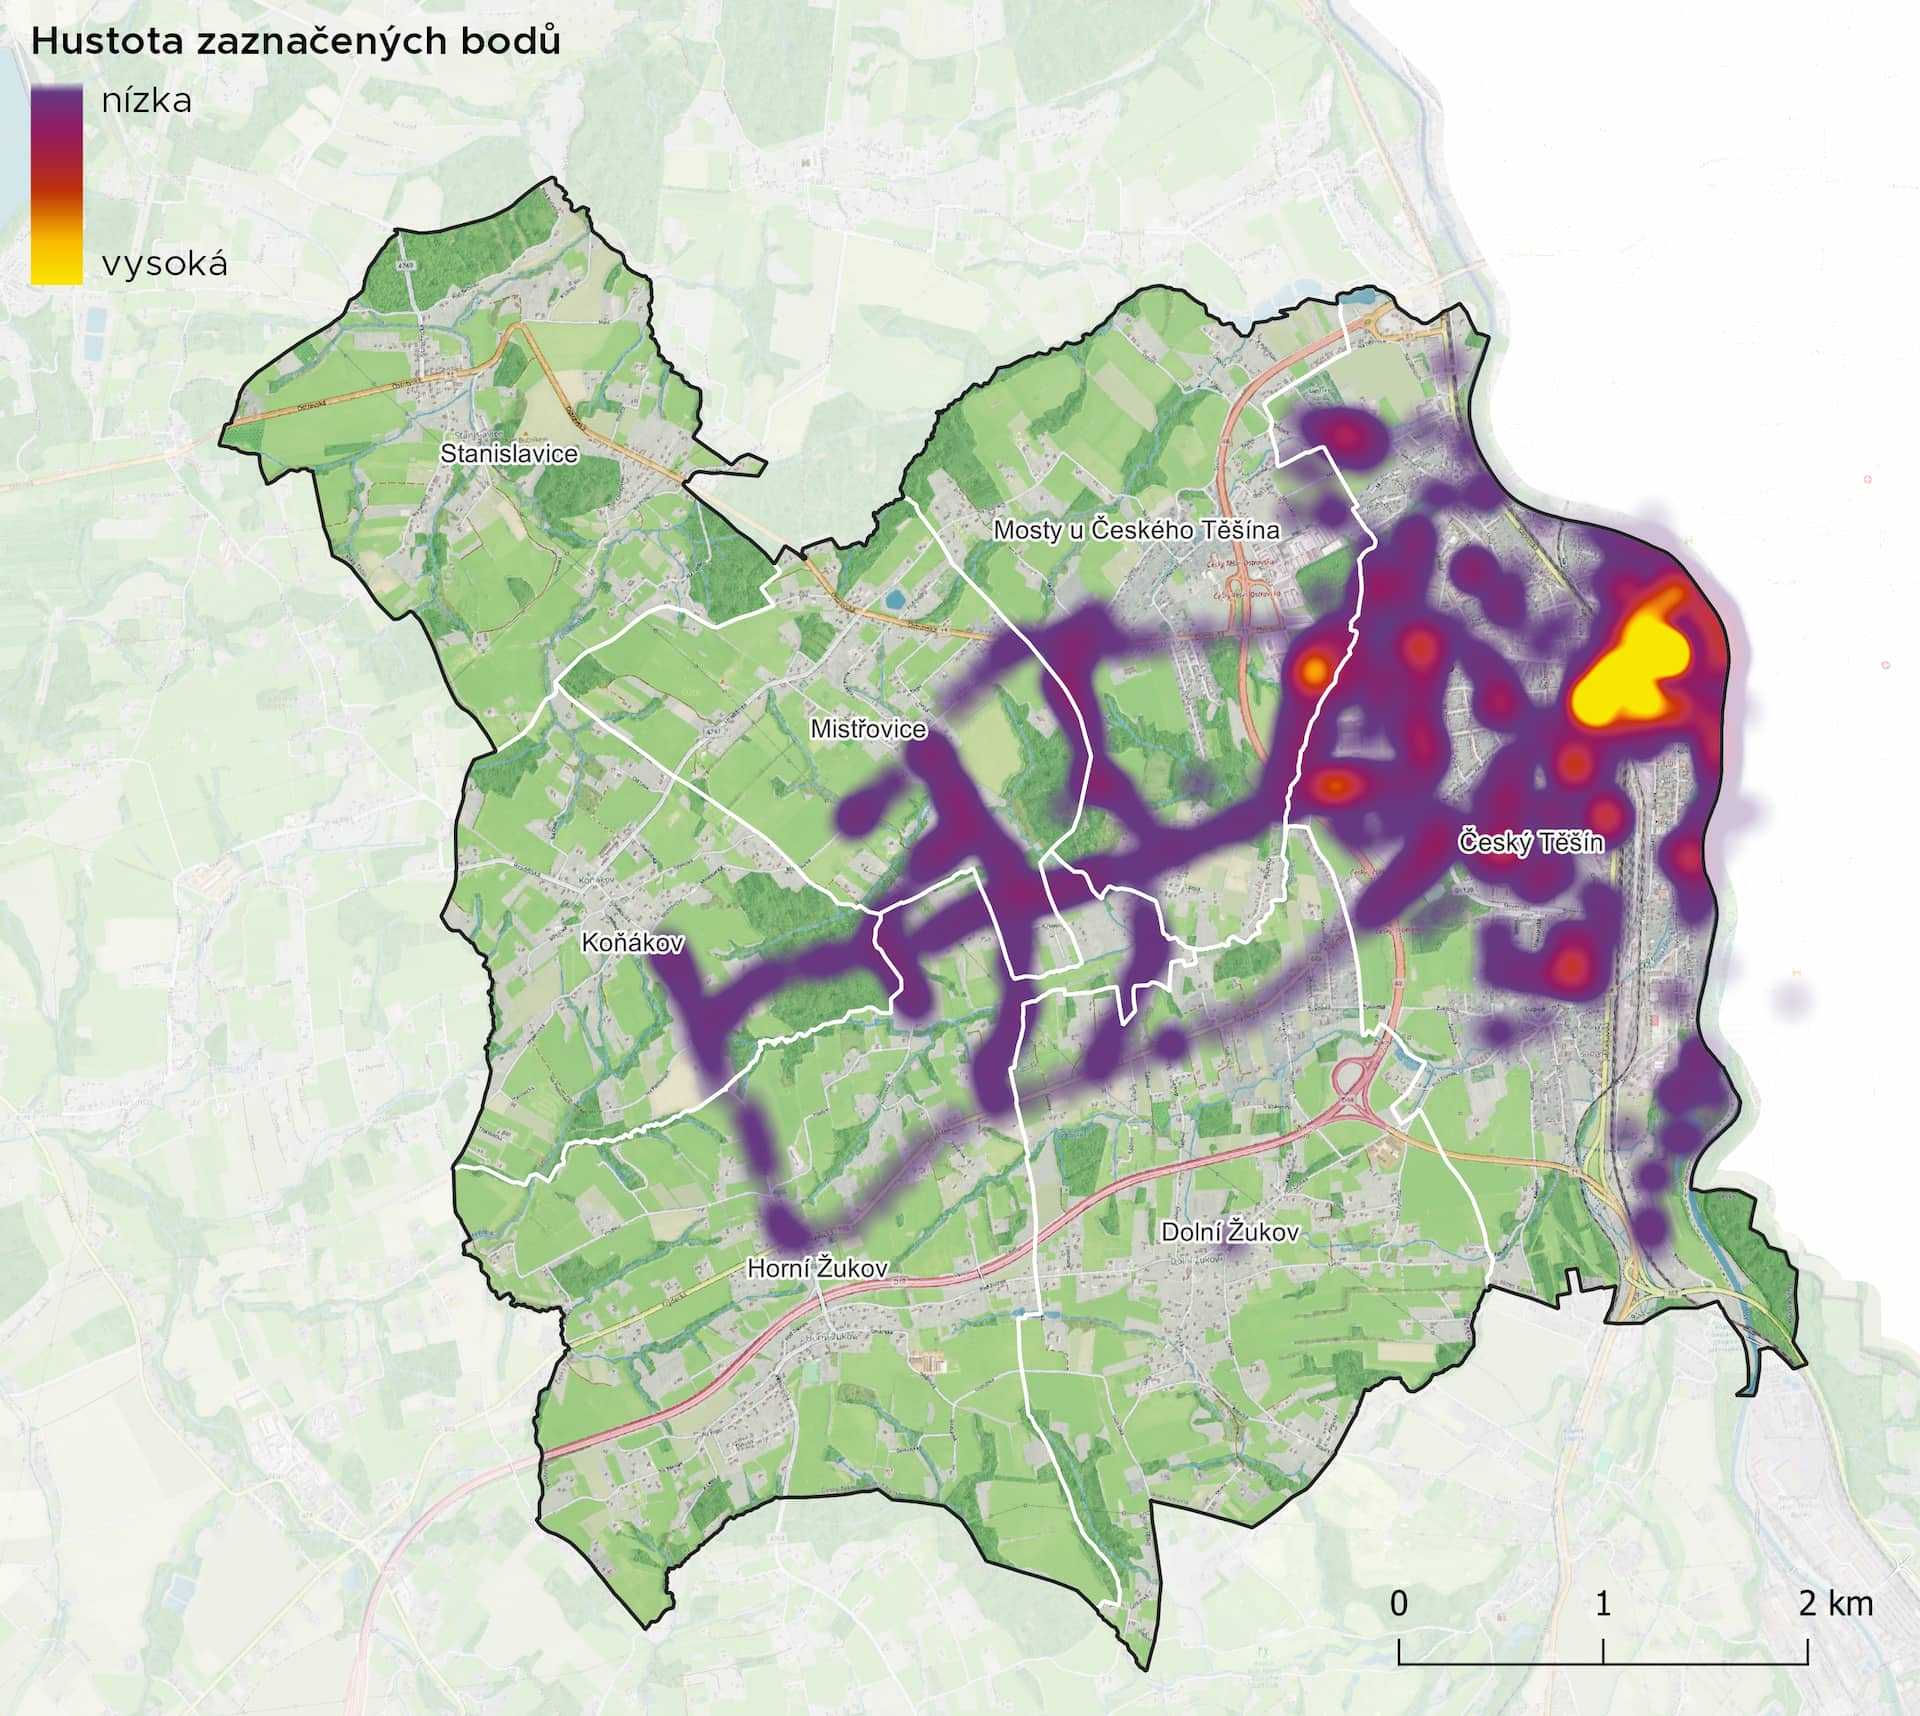
Figure: Perception map of Český Těšín with a colour scale from purple to yellow, showing the density of recorded points, where yellow indicates the highest concentration.
While experts can measure temperatures or model flood risks, only local residents can describe how these phenomena actually impact their lives. That’s why perception maps are so valuable in planning how to prepare a city for climate change. They help us understand where:
• People suffer the most during heatwaves
• Quality urban greenery is missing
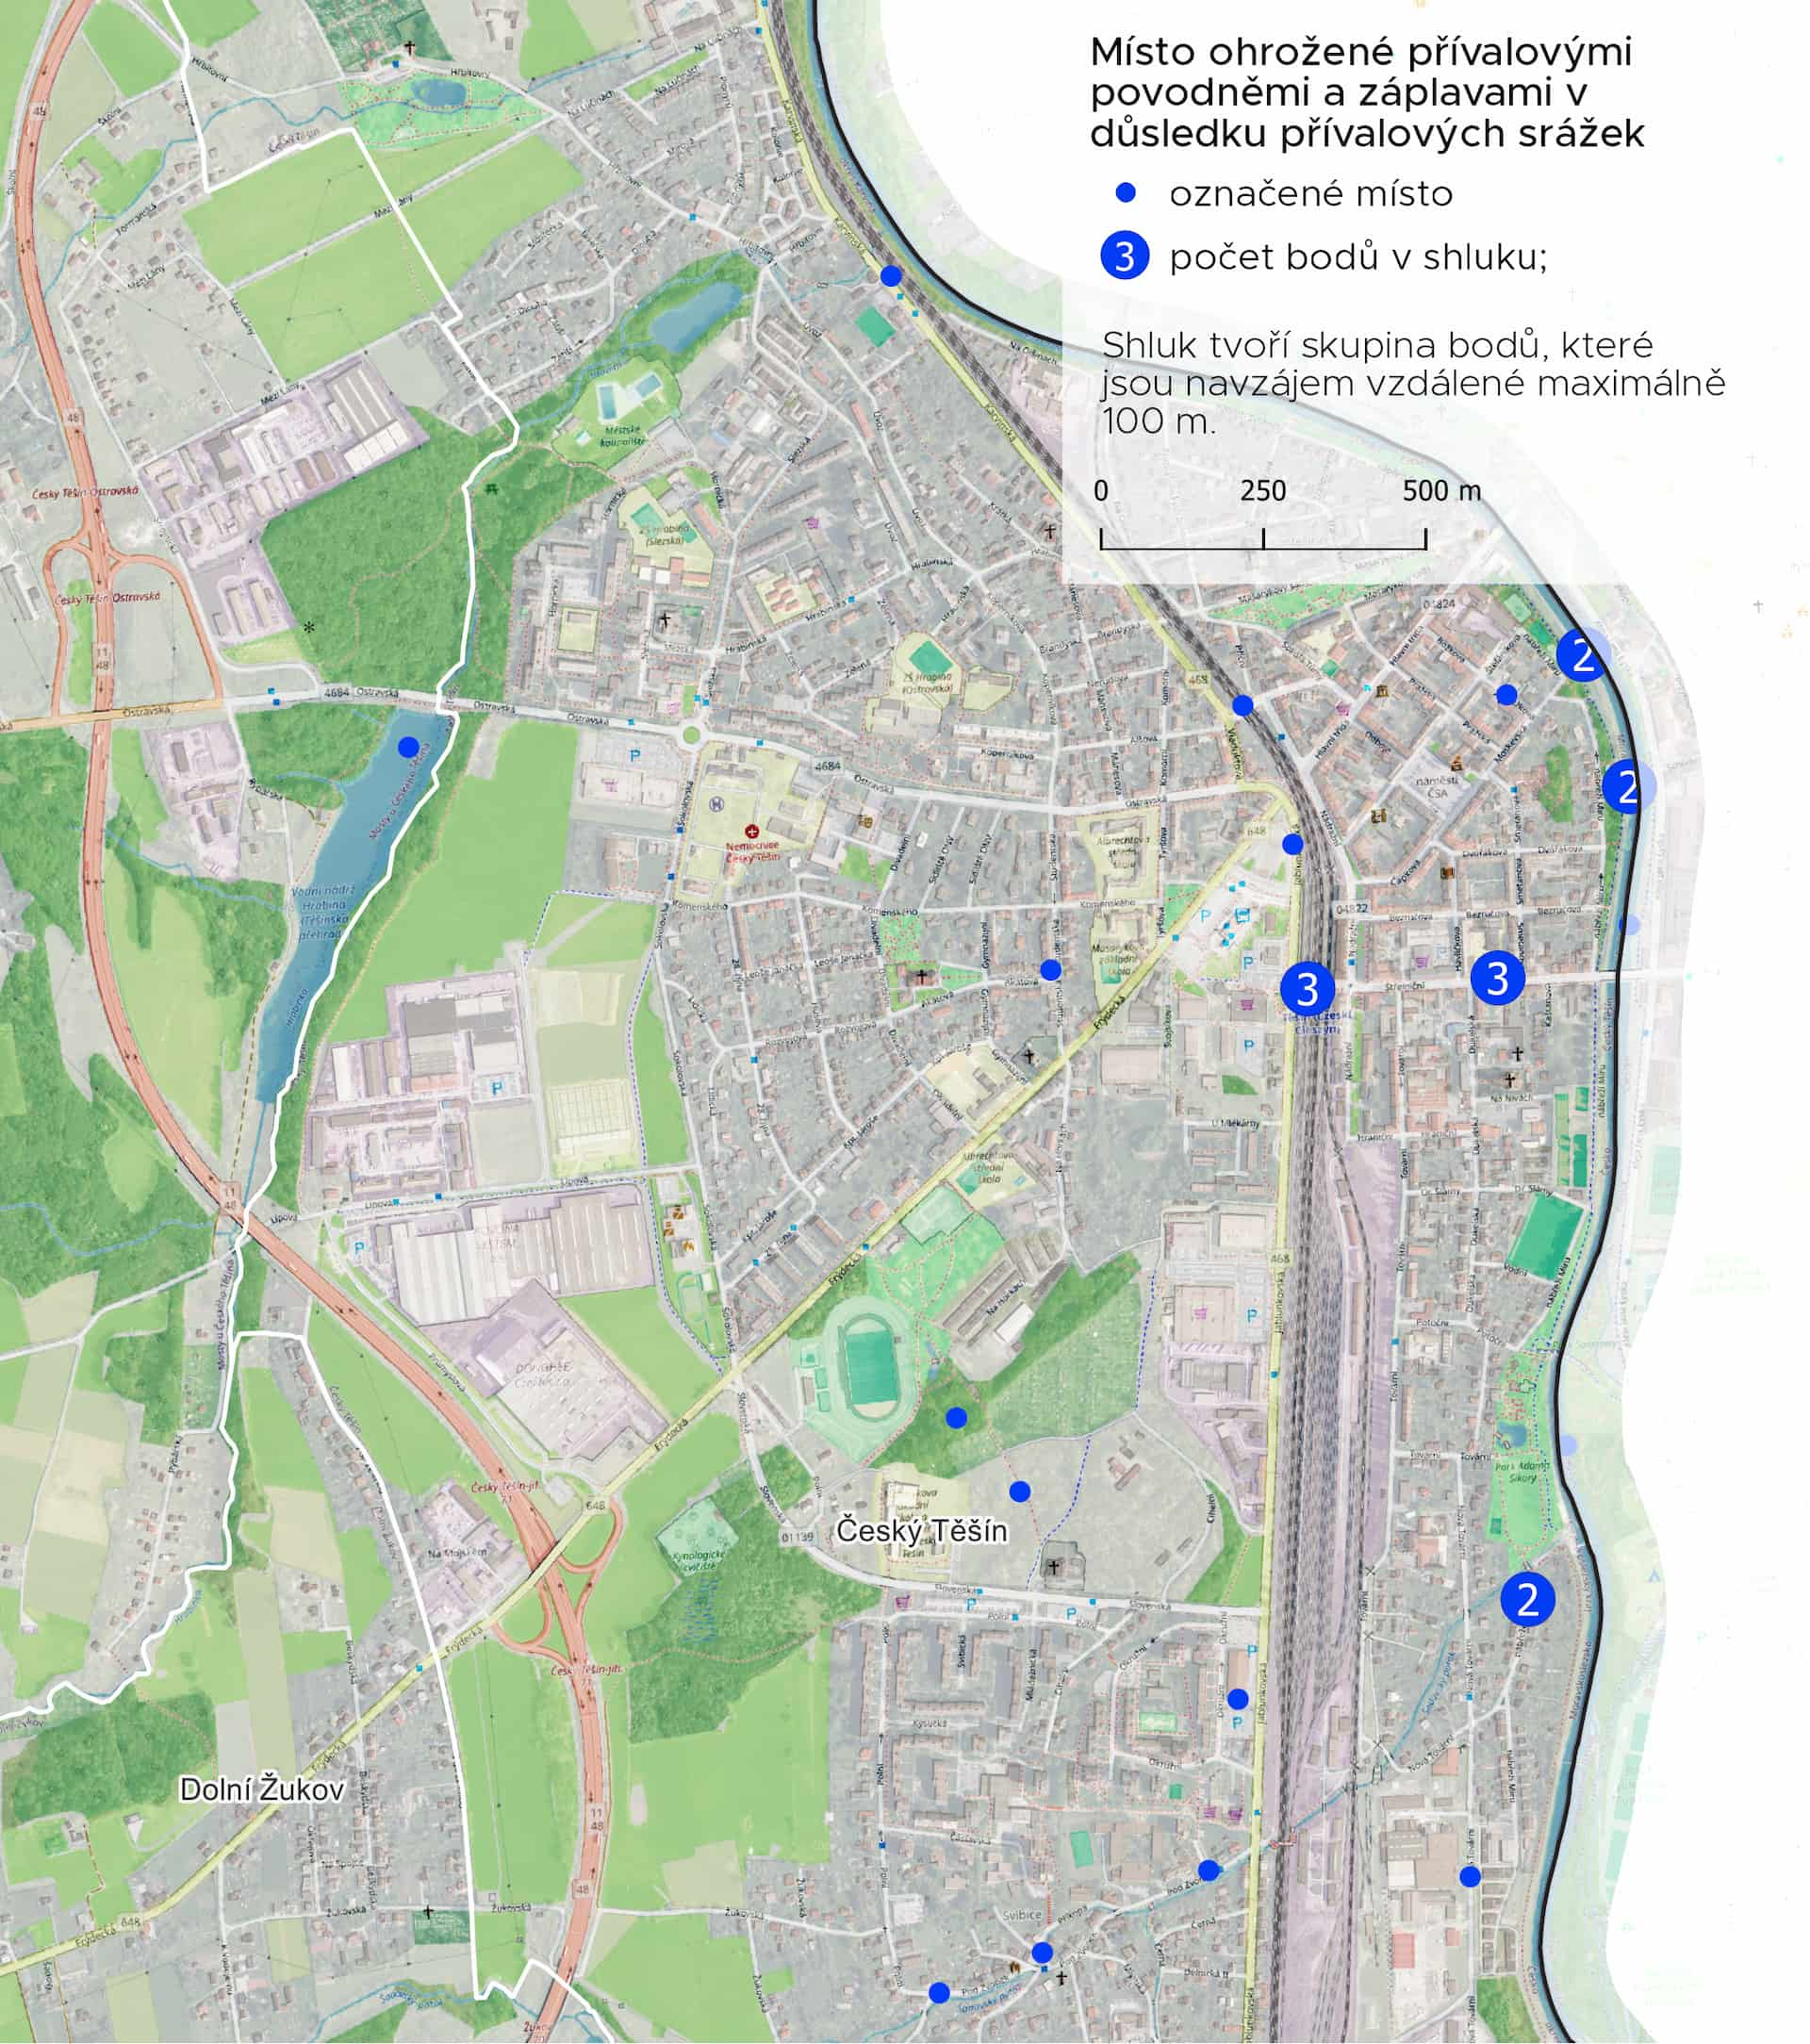
• Flooding is a risk during heavy rain
• The air feels clean and the space is pleasant to relax in
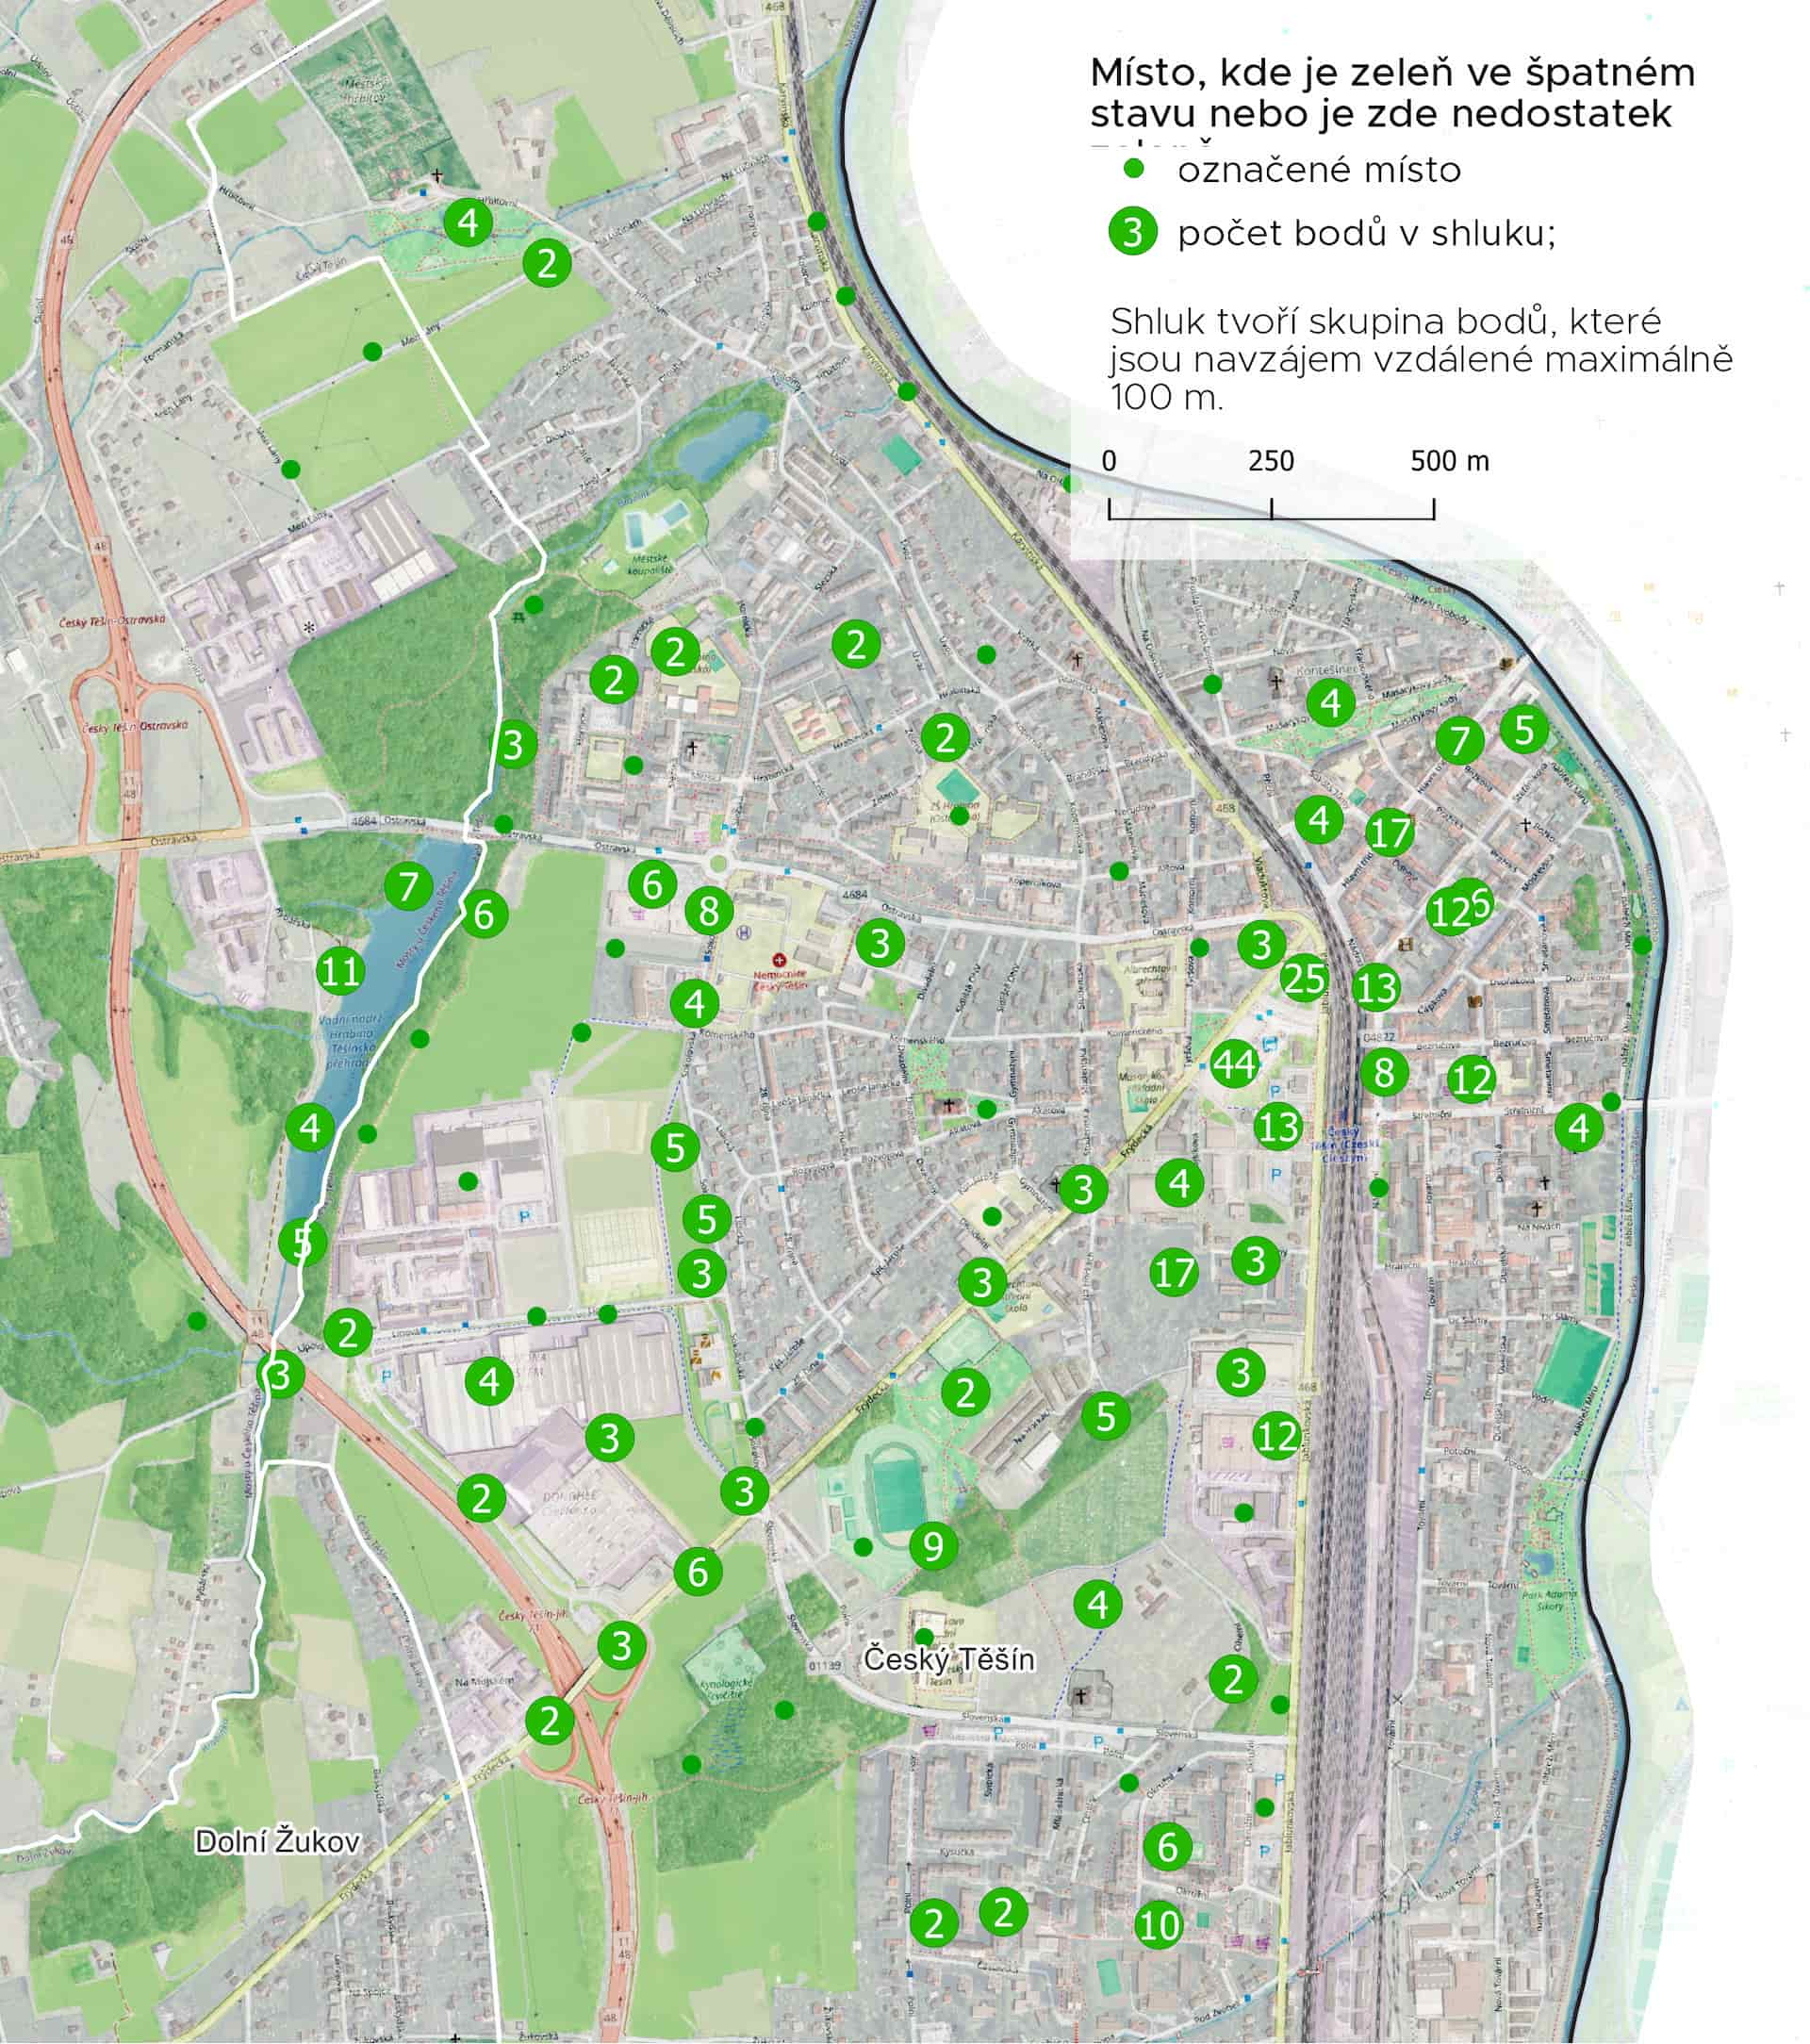
Figure: Perception map of Český Těšín with green dots marking places with a lack of or poor condition of public greenery, grouped in clusters according to the number of suggestions.
“Perception maps are a unique tool that bridges hard analytical data with real-life experiences of residents living in a given area. While temperature maps or runoff models offer valuable theoretical insight, perception maps visualize how these phenomena truly affect people’s daily lives in the city. In Český Těšín, the data from perception maps helped us prioritize adaptation measures exactly where they are most needed – and where they will have the greatest positive impact on residents’ quality of life.”

Turning residents’ subjective experience into valuable data for climate adaptation strategies
When creating climate adaptation strategies, engaging local residents is crucial – no one knows the city better than the people who live in it every day.
So how does this process work in practice?
It all starts with the creation of an interactive online map, which we make accessible to the public. In the case of Český Těšín, we promoted the map through the city’s website, social media, and local media outlets. It’s important that the map is intuitive and easy to fill out, without taking too much time.
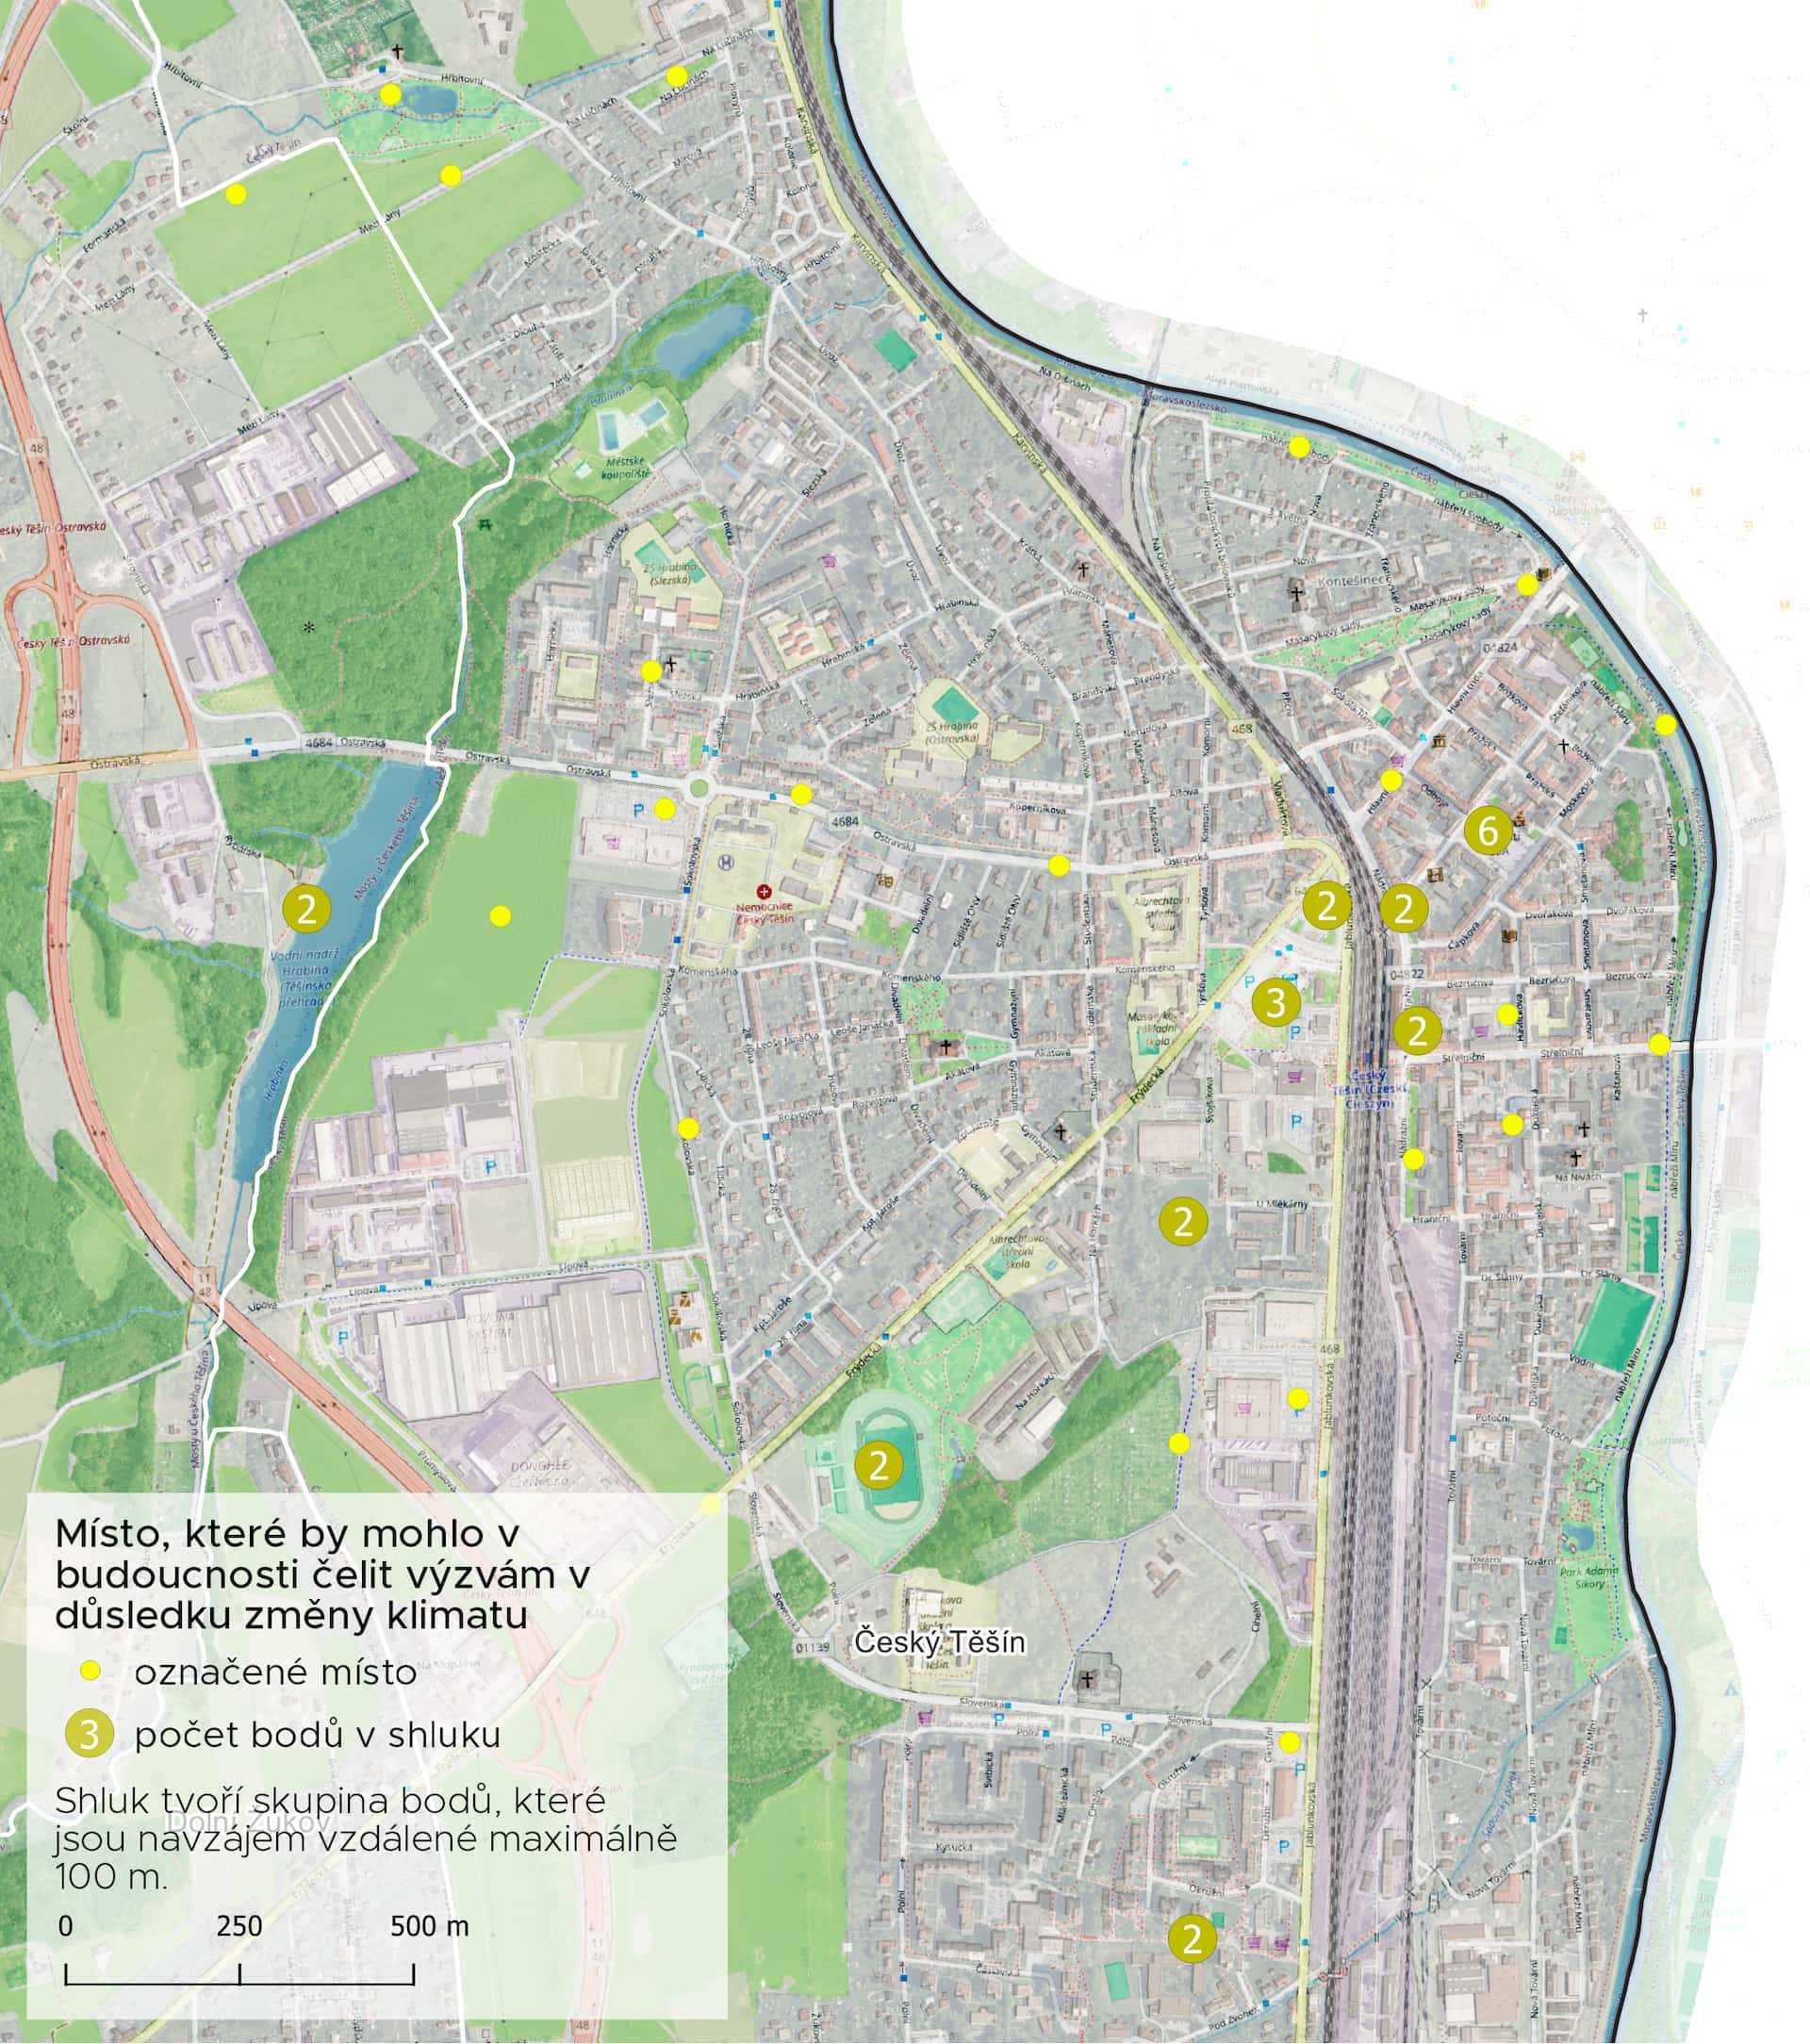
Before publishing the map, however, we have to clearly define what kind of information we want to collect. In Český Těšín, we focused on five key areas: places with a lack of or poor-quality greenery, locations where people feel uncomfortable or comfortable in the heat, areas at risk of flash flooding, and places potentially vulnerable to future climate changes.
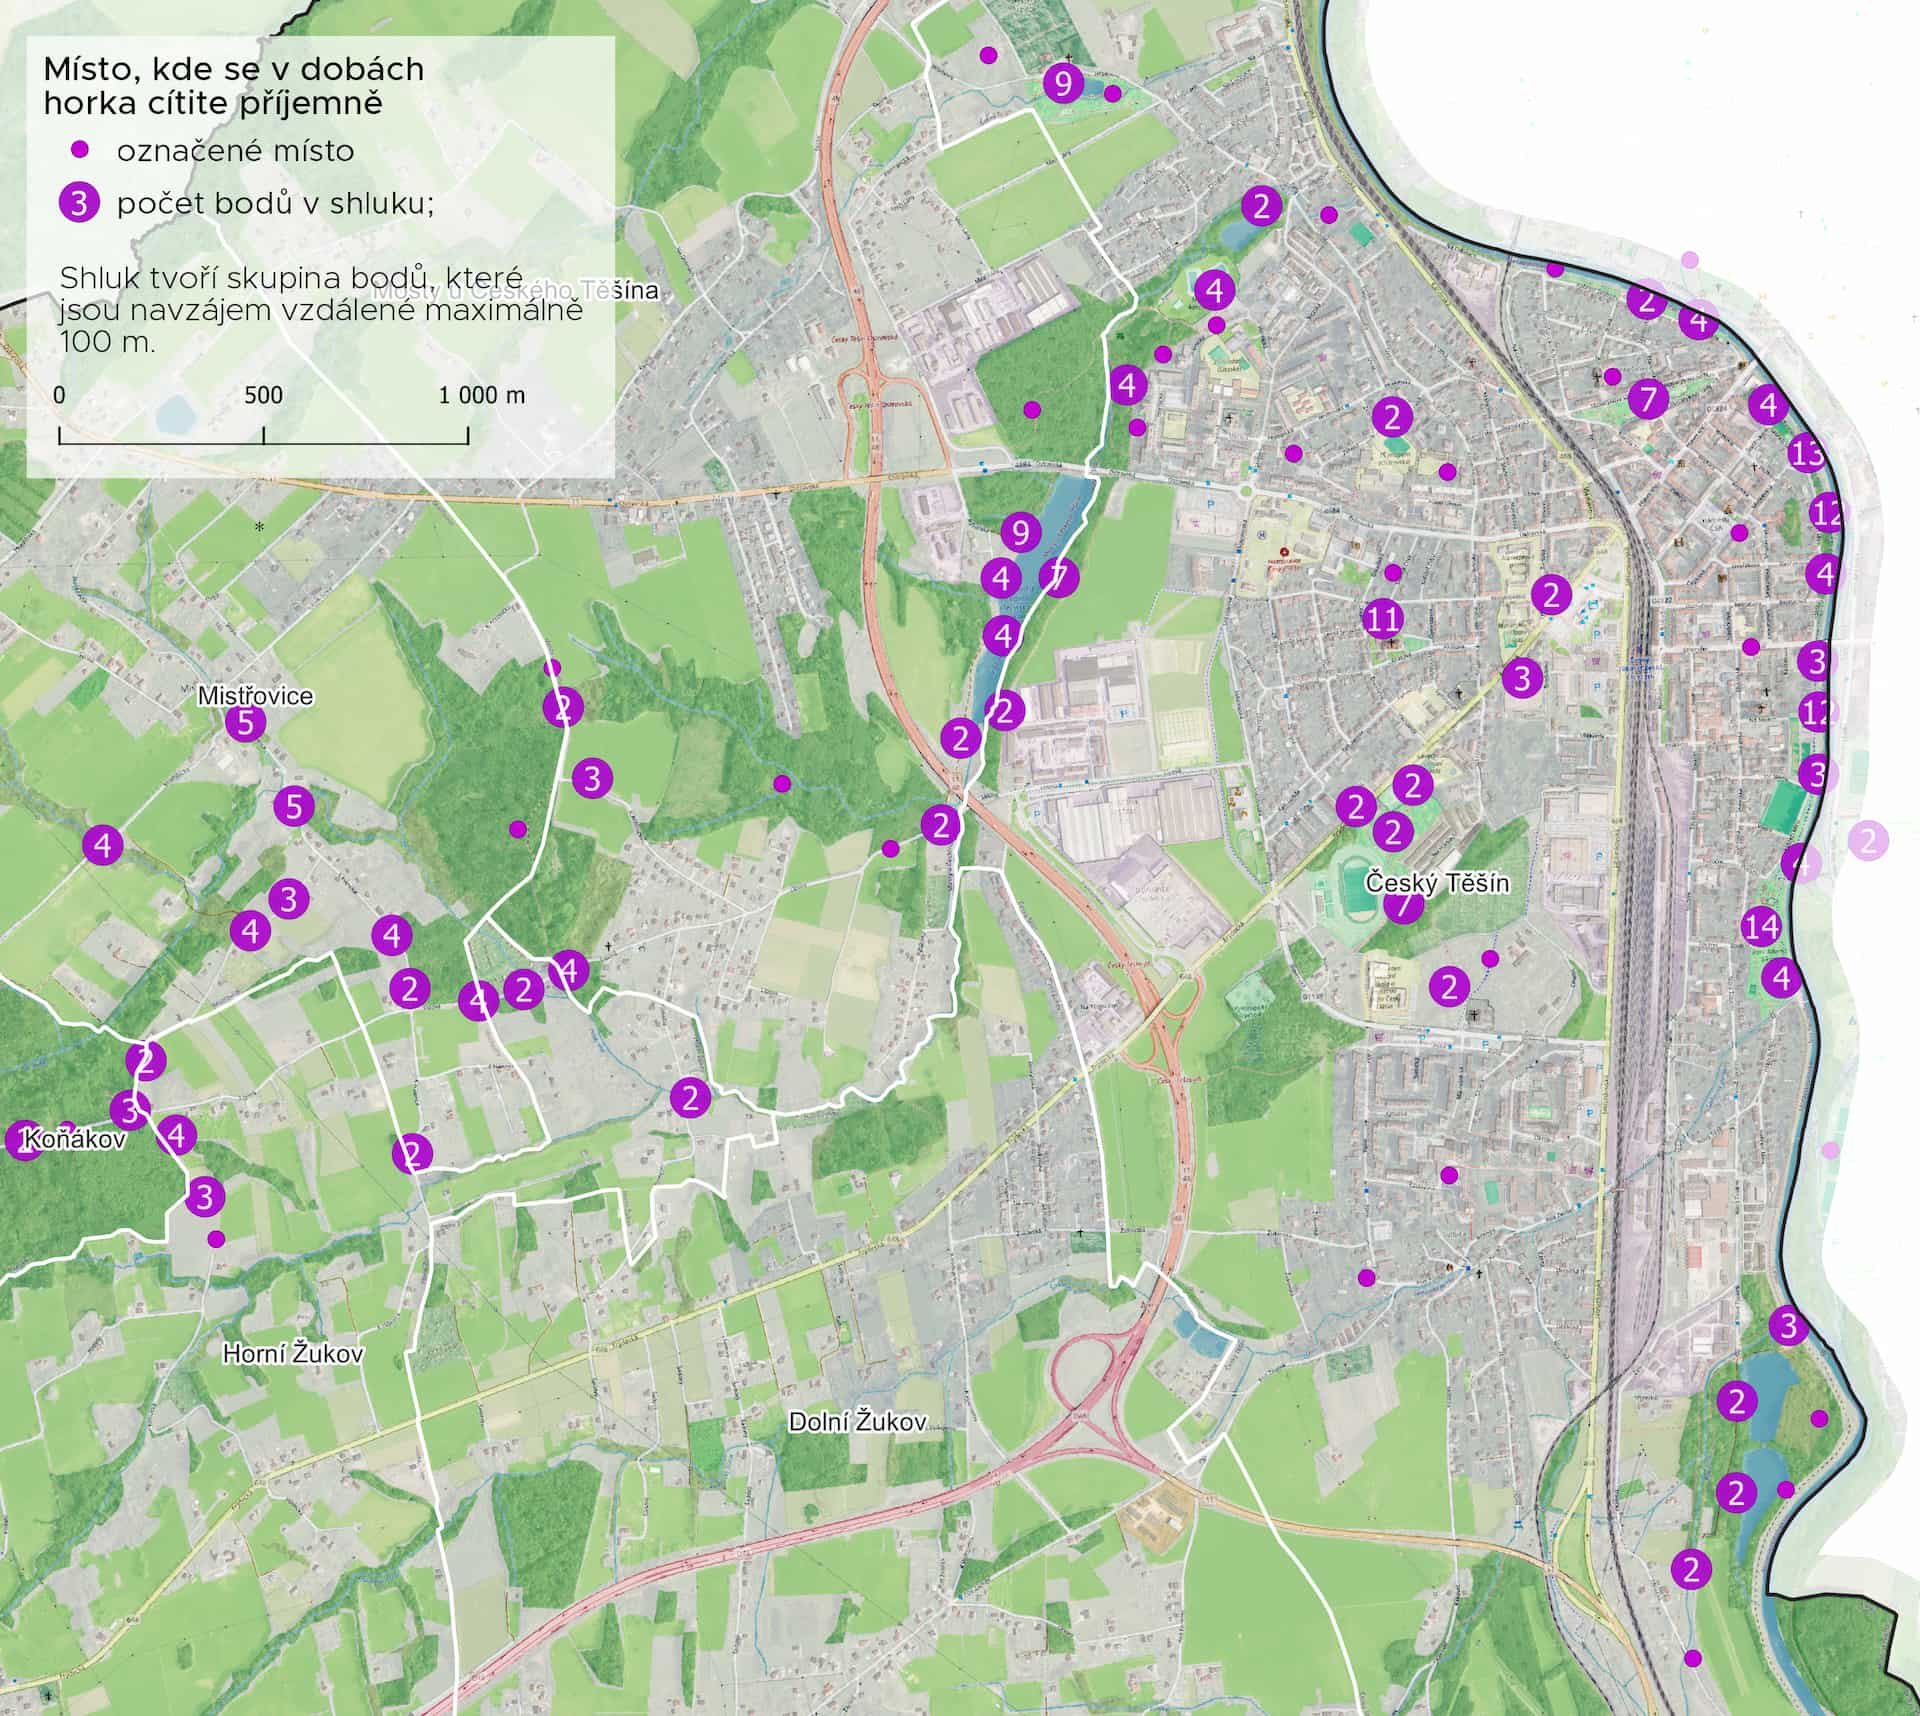
Figure: Perception map with purple dots showing where residents feel comfortable on hot days, with clusters indicated by frequency of responses.
“After data collection, we moved on to analysis. In Český Těšín, 84 respondents took part in the mapping, identifying a total of 1,230 points. During the analysis, we focused on point concentrations in different locations, which helped us identify the most problematic areas in the city. We also tracked the most frequently mentioned issues and suggested solutions – for example, when asked about the lack of greenery, we found that 40% of respondents would welcome mature trees in the marked locations, while flower beds, green roofs, or wildflower meadows were less preferred.”

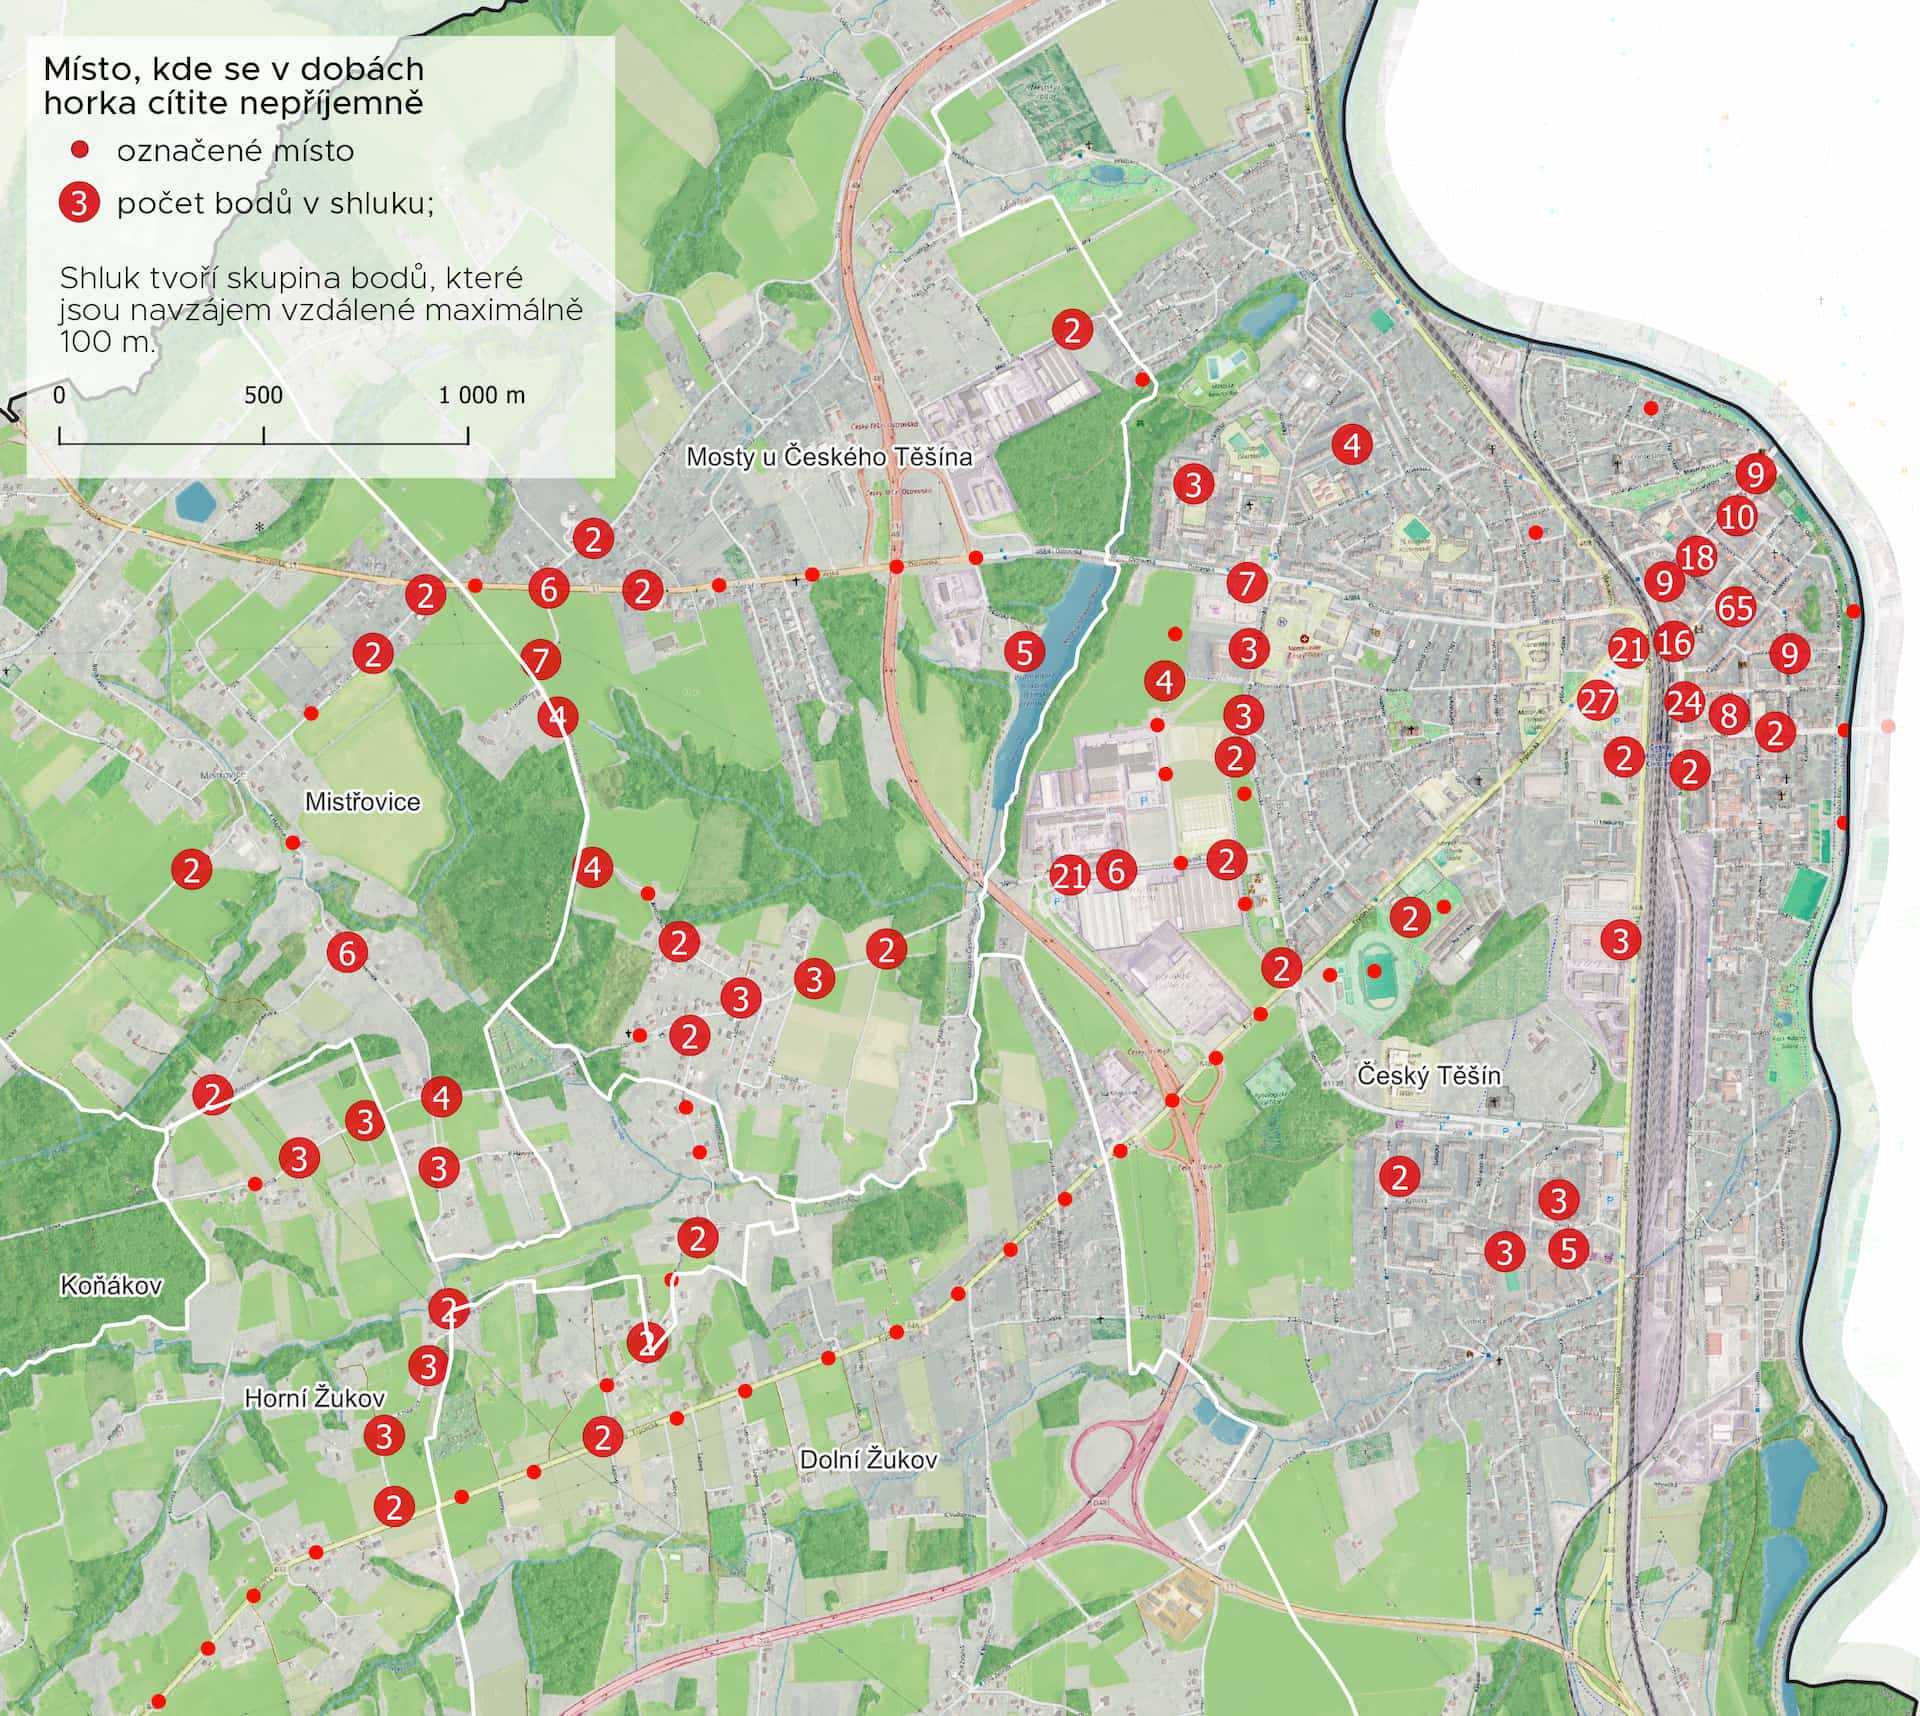
Figure: Perception map with yellow dots indicating places that could face future challenges from climate change impacts such as extreme temperatures, droughts or floods.
Thanks to the combination of expert analyses and the lived experiences of local residents captured in perception maps, adaptation strategies emerge that not only technically address the impacts of climate change, but also truly respond to people’s needs and improve quality of life in the city.
