Get ready

Blog

  • Cooling the concrete jungle: recommendations for introducing new greenery

    urban greenery
  • Perception Maps: The city through the eyes of those who

    Jan Matouš

    Map of the territory of the town of Český Těšín and its local parts, such as Stanislavice, Mistřovice, Koňákov, Horní and Dolní Žukov. The map shows the boundaries of the territory, main roads, green areas and buildings. It does not contain thematic data, it serves as a background orientation map.
  • Seeing the unseen: how near-infrared imagery transforms vegetation management

    Miloslav Kaláb, Climate Resilience SpecialistMiloslav Kaláb

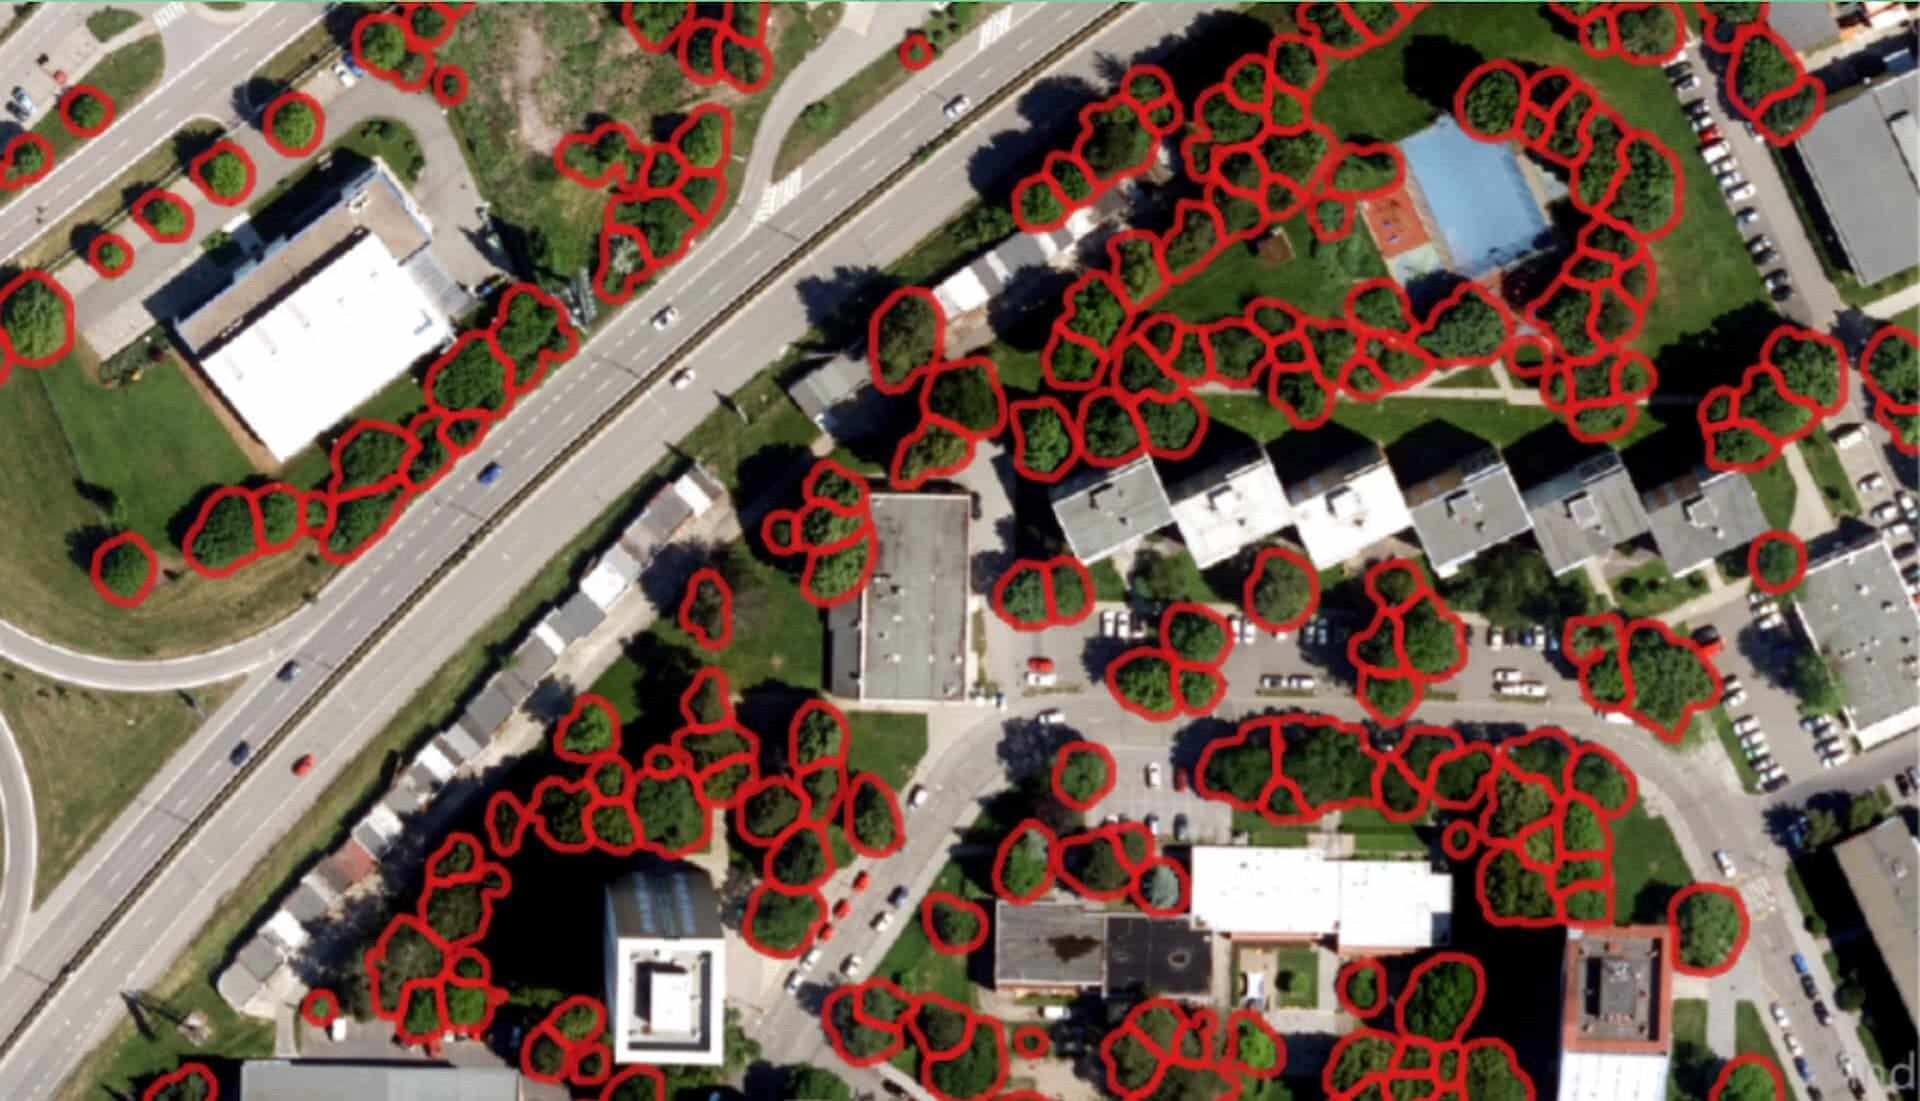
    A satellite image of an urban area with trees automatically detected and outlined in red. The image illustrates an urban greenery segmentation process using near-infrared (NIR) and RGB data to classify vegetation. The segmentation highlights individual tree canopies, emphasizing the distribution of green spaces in a residential neighborhood. A text panel on the right explains the role of NIR in identifying vegetation and how spatial classification is applied to detect trees.
  • 8 key notes from the 3-30-300 Konijnendijk Rule seminar

    Miloslav Kaláb, Climate Resilience SpecialistMiloslav Kaláb

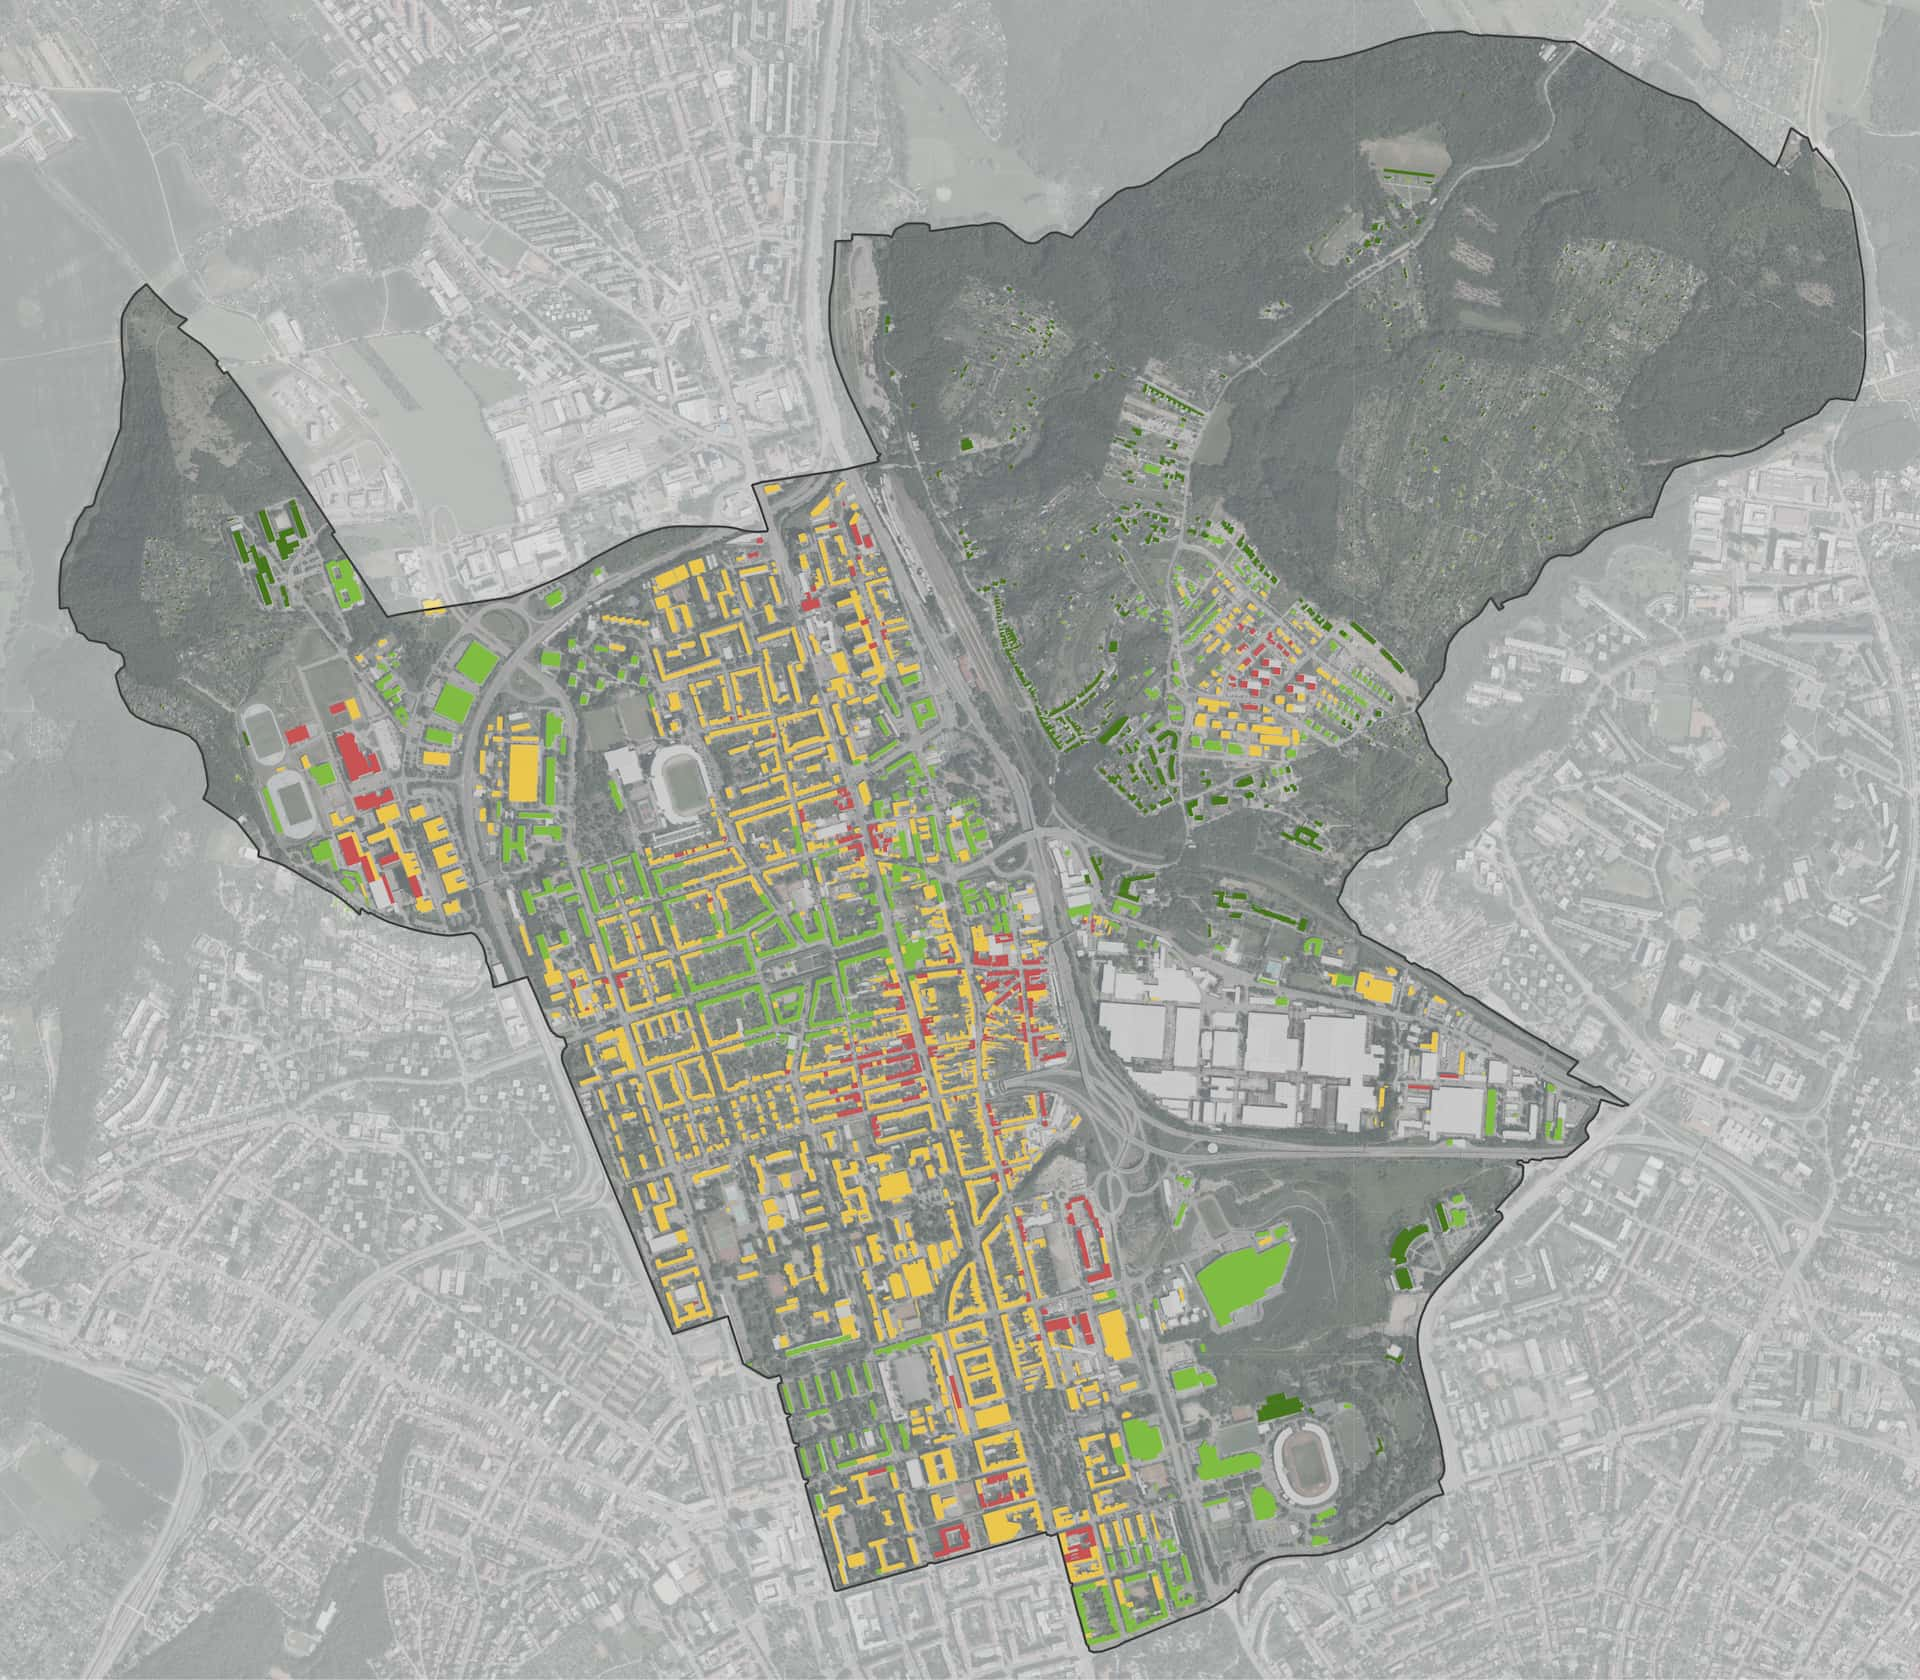
    Image: A synthesismap showcasing the overall compliance with the rule 3-30-300 per-building, each assigned one of the four categories (0 rules met, 1 met, 2 met, 3 met)
  • 3-30-300 and UpGreen: Nature-Based Solutions for Greener, Resilient Cities 

    Miloslav Kaláb, Climate Resilience SpecialistMiloslav Kaláb

    map layer of buildings with the attribute of value (yes/no) for rule 3 of 3-30-300
  • Using Climate Impact Chains (CICs) to strenghthen urban resilience

    Miloslav Kaláb, Climate Resilience SpecialistMiloslav Kaláb

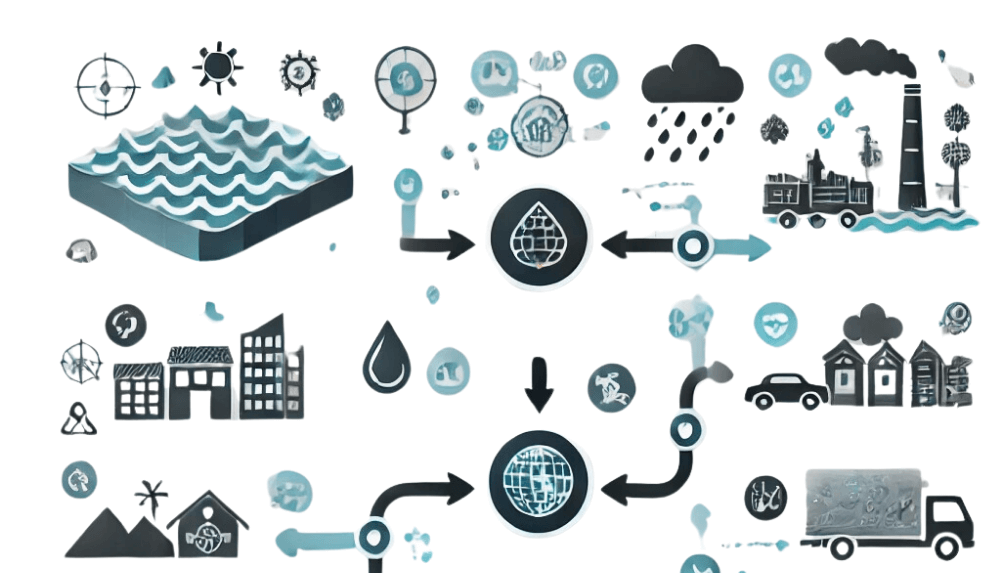
    Visual representation of a climate impact chain showing the sequence from climate hazards, such as flooding or extreme weather, to various urban impacts. Icons depict affected elements like buildings, infrastructure, transportation, and public health. Arrows connect each stage, illustrating the progression from exposure to sensitivity and adaptive capacity. The image highlights the interconnected impacts of climate events on urban systems, aligning with the blog's focus on using Climate Impact Chains (CICs) for understanding and enhancing urban resilience."
  • SECAP: A KEY TOOL FOR A SUSTAINABLE URBAN FUTURE

    Jan Závěšický

    sustainable energy
  • UpGreen at URBIS24

    Jan LabohýJan Labohý

    Segment vitality stress and resilience
  • New articles to your email

    A regular dose of information about news, projects or courses to your email.
    Kontaktní formulář (footer)
    By subscribing to the newsletter, you agree to the terms of personal data protection.